What are the grey bars in Screen Time?
I try not to be on my iPhone (hence my guides for automatically making it grayscale and not knowing your Screen Time code). The main tool for keeping tabs on this is Apple's Screen Time feature which, while limited in granularity, is better than nothing—until it's wrong. Recently Screen Time started showing large, undetailed grey bars, 1 Couldn't tell you why I use grey instead of gray. The 'a' just feels so harsh. none of which matched up to the Most Used categories:
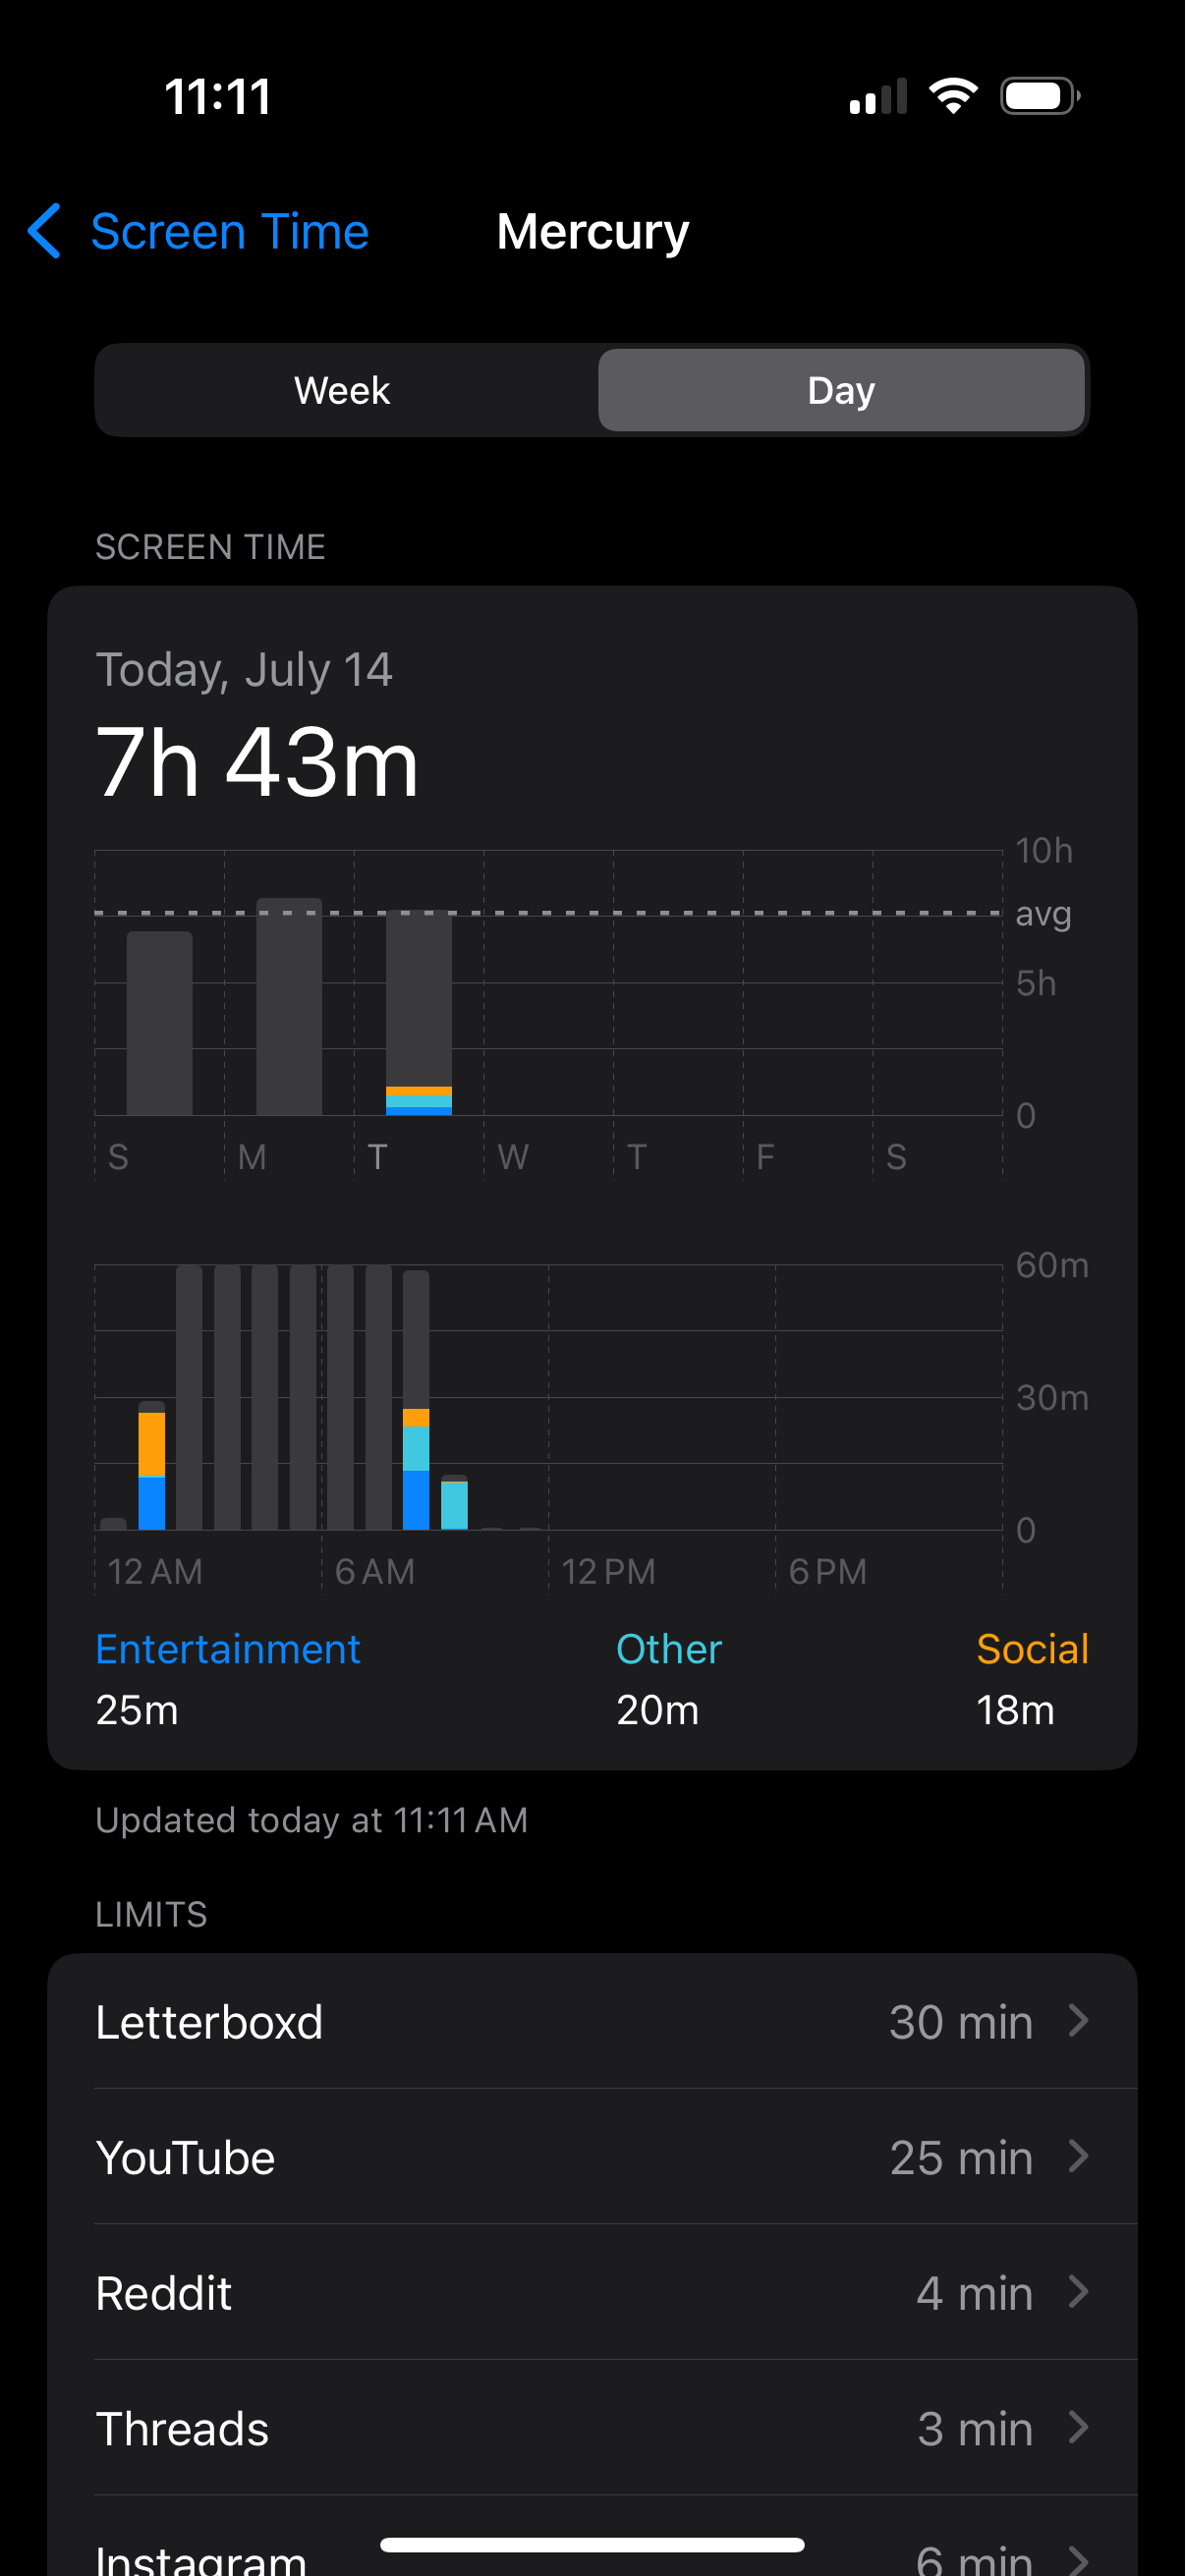
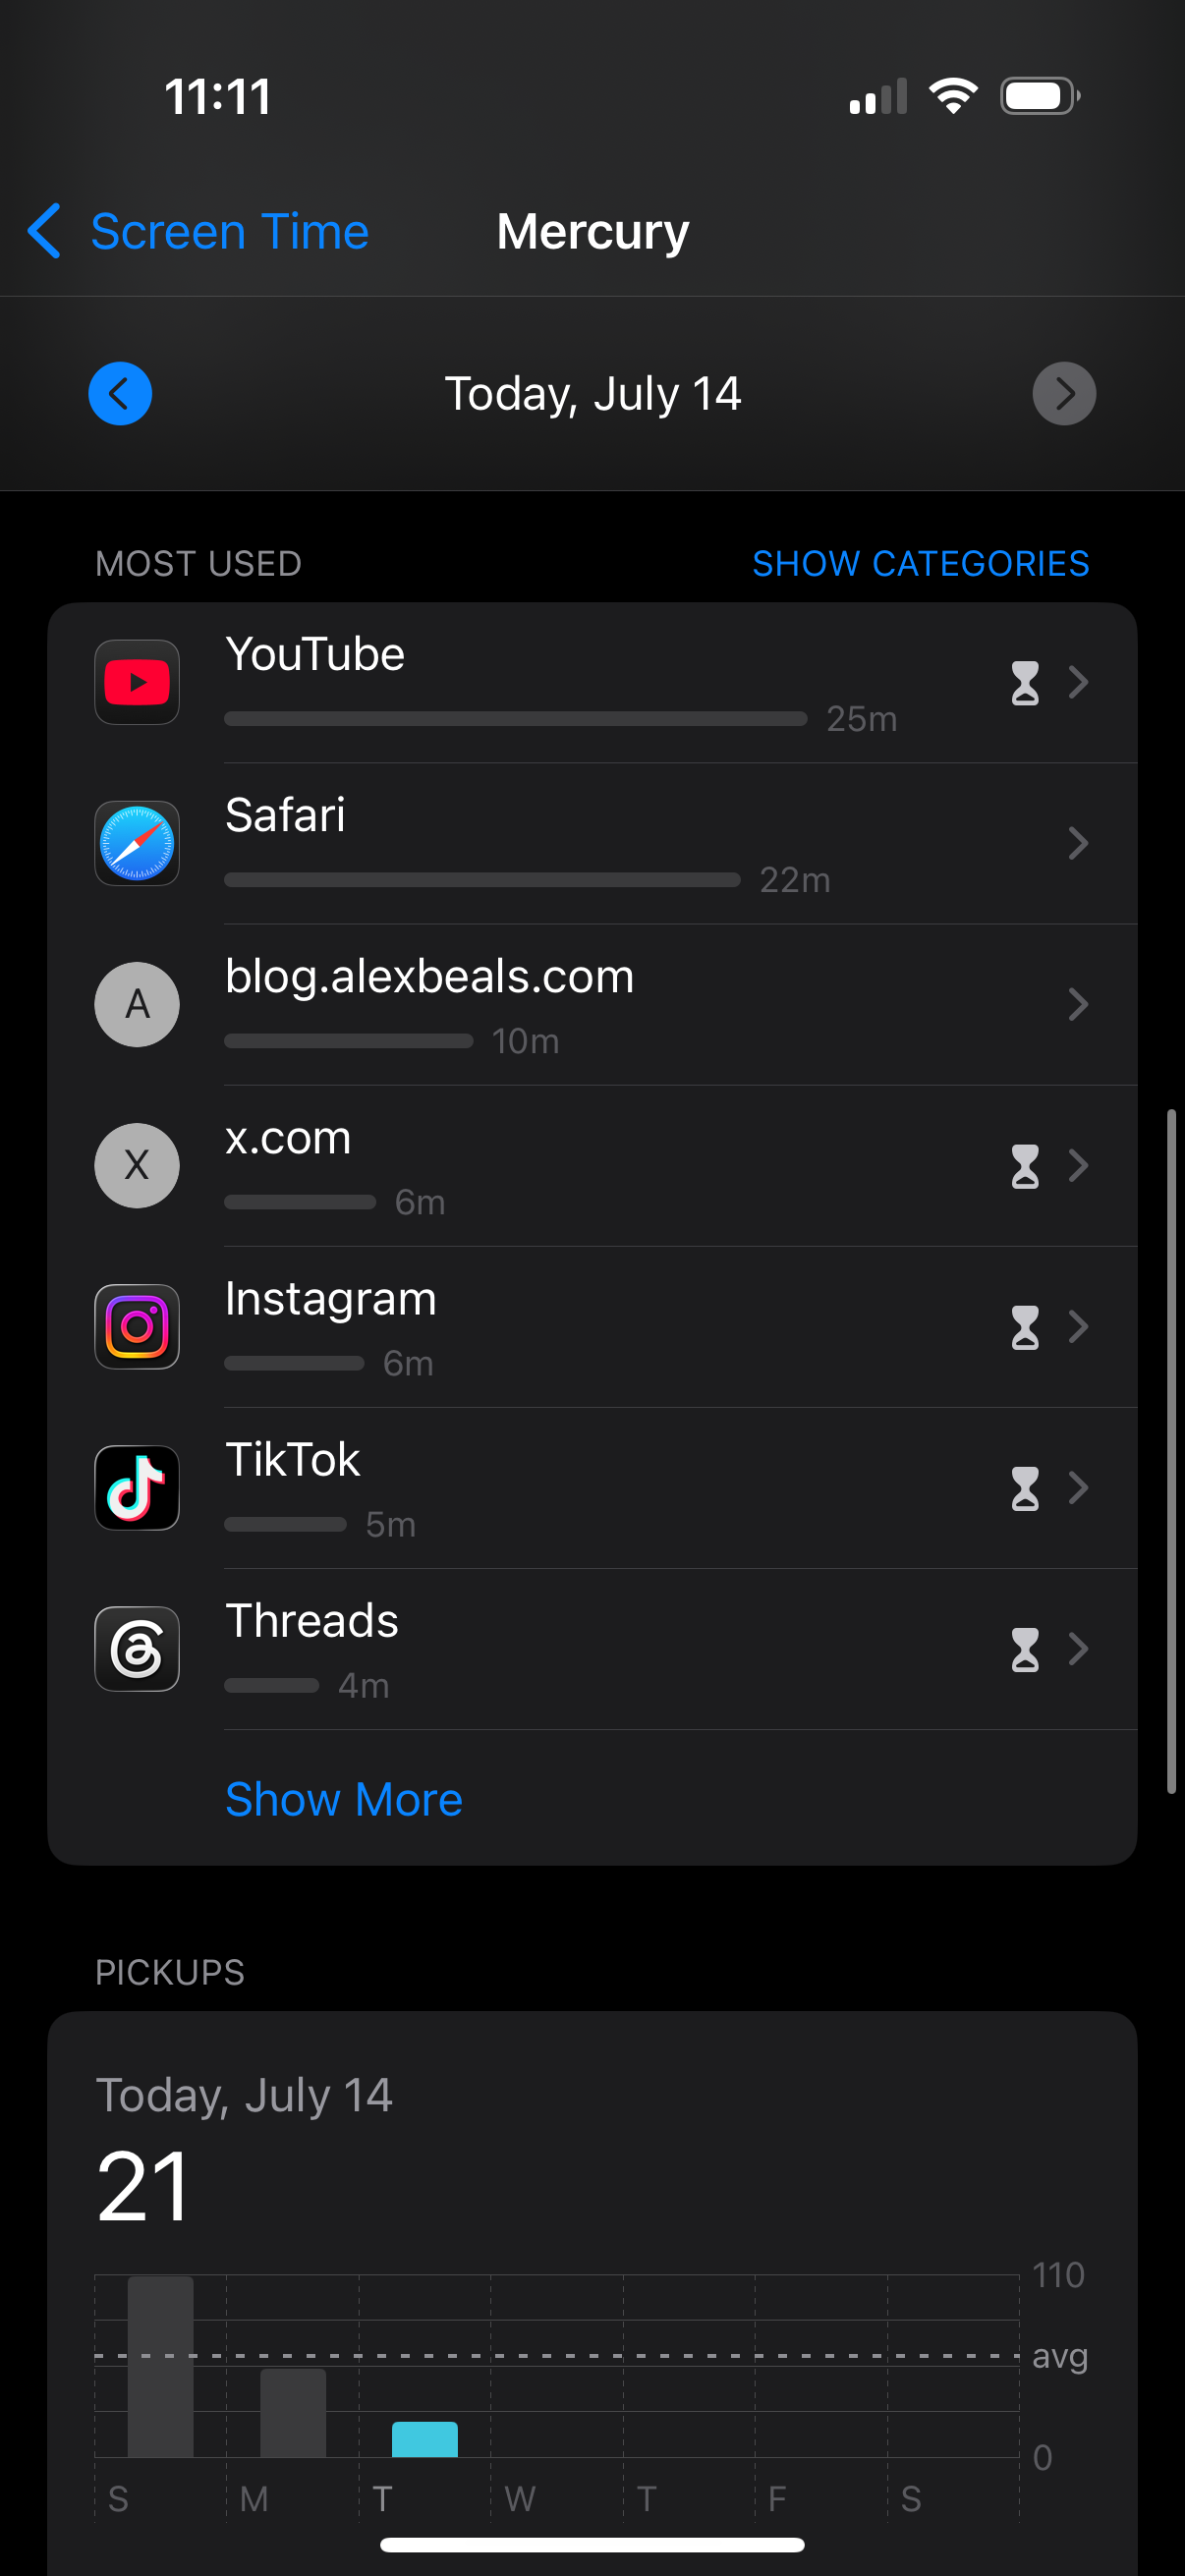
Where does that time come from? 2 If you're a destination over journey type, jump here. But why? Life's short, but the road is always better than the inn.
Pop the hood with a jailbreak
First we'll need to abandon my daily driver for a jailbroken iPhone with completely different times (don't worry, we'll come back to the unaccounted 6 hours). Using FLEX
3
You can install from GitHub and then triple-tap any screen to inspect views and controllers.
you can click into the rendering and trace the data source over XPC to a different service, com.apple.ScreenTimeAgent.persistence, which returns STUsageBlocks. If we connect to that process we can set a breakpoint for SQL queries and see what database it's using:
# SSH into the iPhone
ssh mobile@192.168.0.40
# Find the process ID
ps -Ao pid,comm | grep 'ScreenTimeAgent'
#  2059 /System/Library/PrivateFrameworks/ScreenTimeCore.framework/ScreenTimeAgent
debugserver-16 "0.0.0.0:1234" --attach=2059
lldb
process connect connect://192.168.0.40:1234
breakpoint set -n "-[NSSQLiteConnection prepareSQLStatement:]"
po [$x0 valueForKey:@"_dbPath"]
# /var/mobile/Library/Application Support/com.apple.remotemanagementd/RMAdminStore-Local.sqliteWe can then copy the RMAdminStore-Local.sqlite database off the phone with a scp command.
4
Secure Copy, as opposed to the paranormal SCP. Probably?
scp -r 'mobile@192.168.0.40:/var/mobile/Library/Application Support/com.apple.remotemanagementd/RMAdminStore-*.sqlite*' ~/screentime/Running queries against RMAdminStore-Local.sqlite
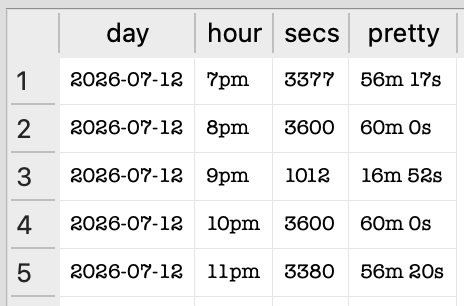
We can run po $x2 to see the SQL, which falls into two categories: ZUSAGEBLOCK which queries the blocks for the bar chart, and ZUSAGETIMEDITEM which queries the named categories. We can then use the downloaded database and mirror the Screen Time queries with the following:
SELECT
  -- Apple uses the number of seconds since January 1, 2001 as CoreData time,
  -- so just add 978307200 to convert to standard Unix timestamps
  STRFTIME('%Y-%m-%d', blk.ZSTARTDATE + 978307200, 'unixepoch', 'localtime') AS day,
  LTRIM(LOWER(STRFTIME('%I%p', blk.ZSTARTDATE + 978307200, 'unixepoch', 'localtime')), '0') AS hour,
  blk.ZSCREENTIMEINSECONDS AS secs,
  (blk.ZSCREENTIMEINSECONDS/60)
    || 'm '
    || (blk.ZSCREENTIMEINSECONDS%60)
    || 's' AS pretty
FROM ZUSAGEBLOCK blk
JOIN ZUSAGE u ON blk.ZUSAGE = u.Z_PK
WHERE u.ZDEVICE IS NULL
ORDER BY blk.ZSTARTDATE;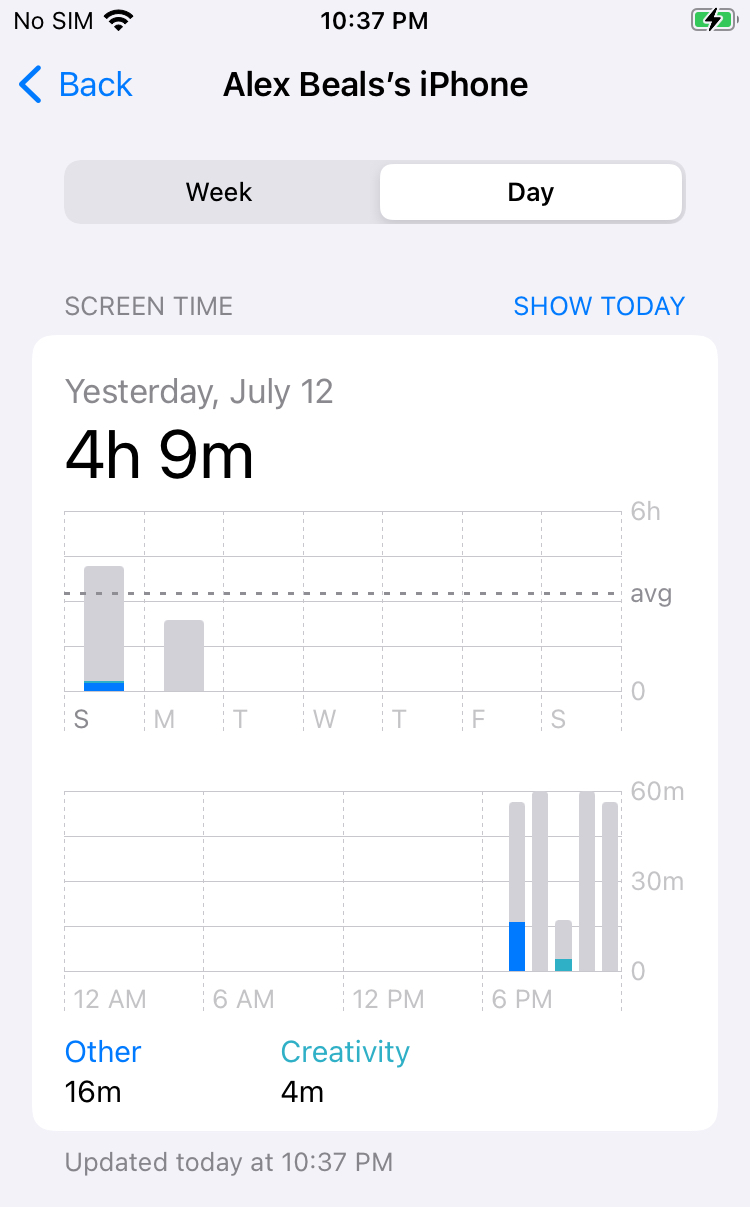
SELECT
  DATE(blk.ZSTARTDATE + 978307200, 'unixepoch', 'localtime') AS DAY,
  COALESCE(ti.ZBUNDLEIDENTIFIER, ti.ZDOMAIN) AS item,
  SUM(ti.ZTOTALTIMEINSECONDS) AS secs,
  (SUM(ti.ZTOTALTIMEINSECONDS)/3600)
    || 'h '
    || ((SUM(ti.ZTOTALTIMEINSECONDS)%3600)/60)
    || 'm' AS pretty
FROM ZUSAGETIMEDITEM ti
JOIN ZUSAGECATEGORY cat ON ti.ZCATEGORY = cat.Z_PK
-- 😬 It's mostly ZUSAGETIMEDITEM, but it still uses ZUSAGEBLOCK to dedupe
JOIN ZUSAGEBLOCK blk ON cat.ZBLOCK = blk.Z_PK
JOIN ZUSAGE u ON blk.ZUSAGE = u.Z_PK
-- The aggregated view across devices
WHERE u.ZDEVICE IS NULL
GROUP BY DAY,
  item
ORDER BY DAY,
  secs DESC;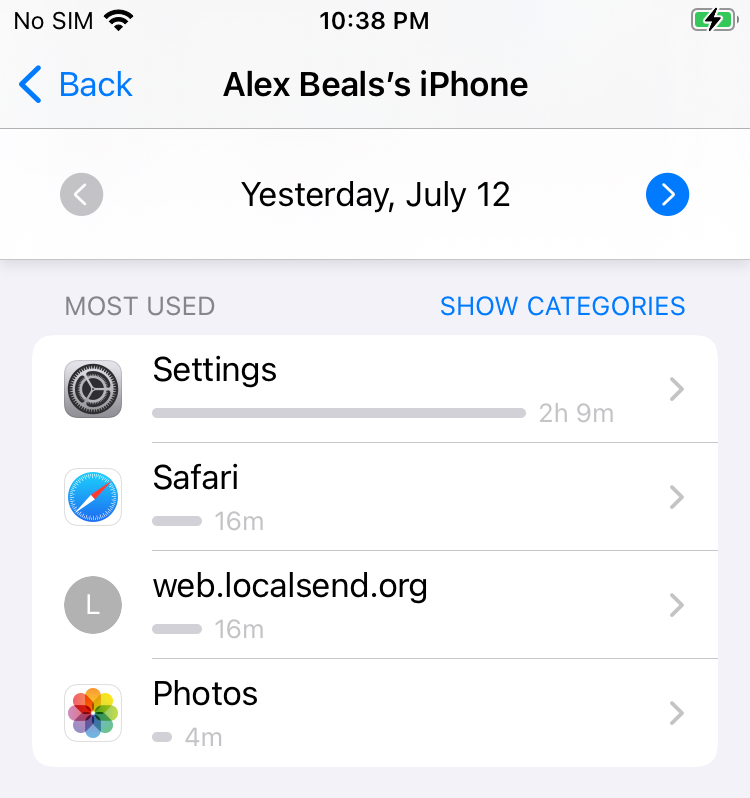
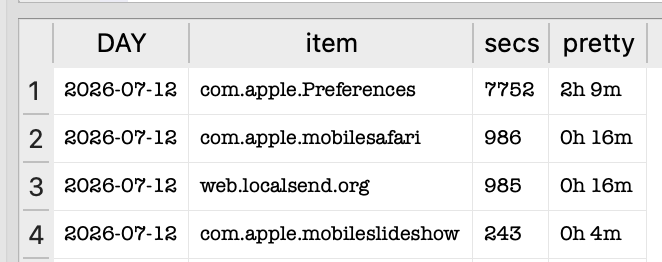
Great! We can reproduce the queries...but they're not showing the missing time. Since the queries don't filter anything, Screen Time isn't hiding it: it just never lands in RMAdminStore-Local.sqlite. Upstream we go!
5
Put me in the tube. 
Looking through knowledgeC.db
CoreDuet is the background daemon
6
 Admittedly he's less background and more upfront, though he's certainly in the know on events!
that tracks system events. It stores the raw information in
Admittedly he's less background and more upfront, though he's certainly in the know on events!
that tracks system events. It stores the raw information in knowledgeC.db, and while it may not be the source of RMAdminStore-Local.sqlite
7
I didn't breakpoint on writes to the DB, so not sure exactly how it's aggregated.
we can use it regardless to figure out where that time is being spent.
First we need to download it locally:
scp -r 'mobile@192.168.0.40:/var/mobile/Library/CoreDuet/Knowledge/*.db*' ~/Desktop/knowledge/The ZOBJECT table has a lot of streams
8
66 of them on my device, ranging from /notification/usage to /media/nowPlaying to /display/orientation and more!
but we need /app/inFocus. Querying time breakdowns from that should bypass most app filtering.
SELECT
  ZVALUESTRING AS bundle,
  SUM(ZENDDATE - ZSTARTDATE) AS seconds,
  (SUM(ZENDDATE - ZSTARTDATE)/3600)
    || 'h '
    || ((SUM(ZENDDATE - ZSTARTDATE)%3600)/60)
    || 'm' AS prettym,
  COUNT(*) AS intervals
FROM ZOBJECT
WHERE ZSTREAMNAME = '/app/inFocus'
  AND DATE(ZSTARTDATE + 978307200, 'unixepoch', 'localtime') = '2026-07-12'
GROUP BY bundle
HAVING seconds > 0
ORDER BY seconds DESC;
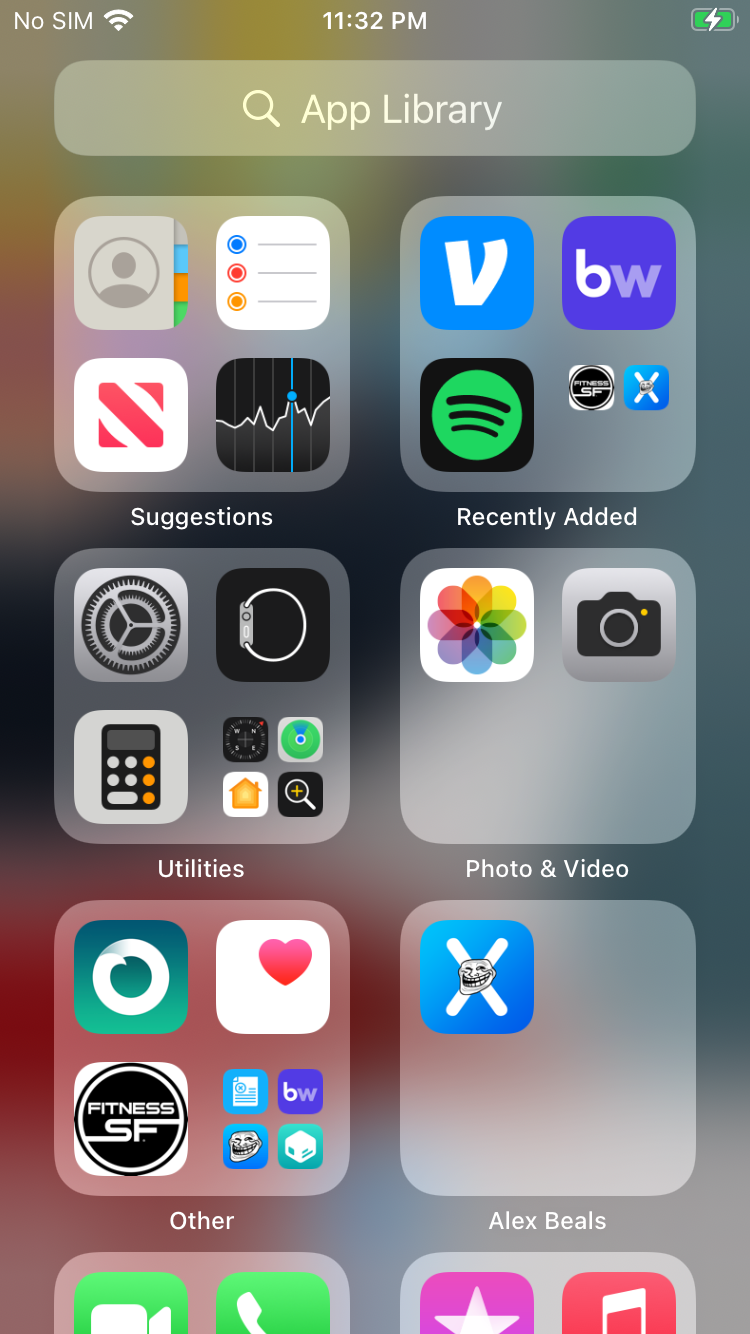
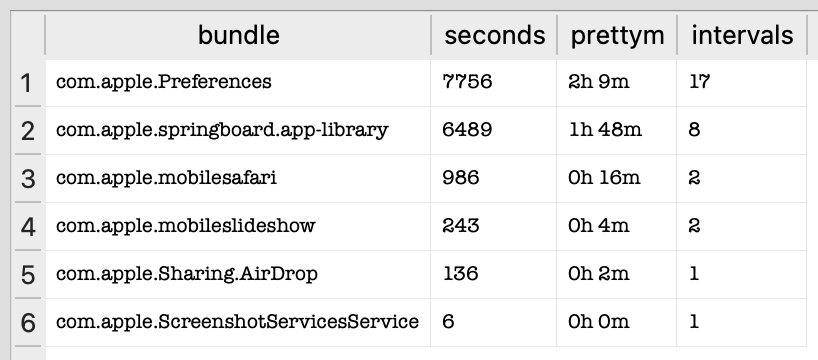
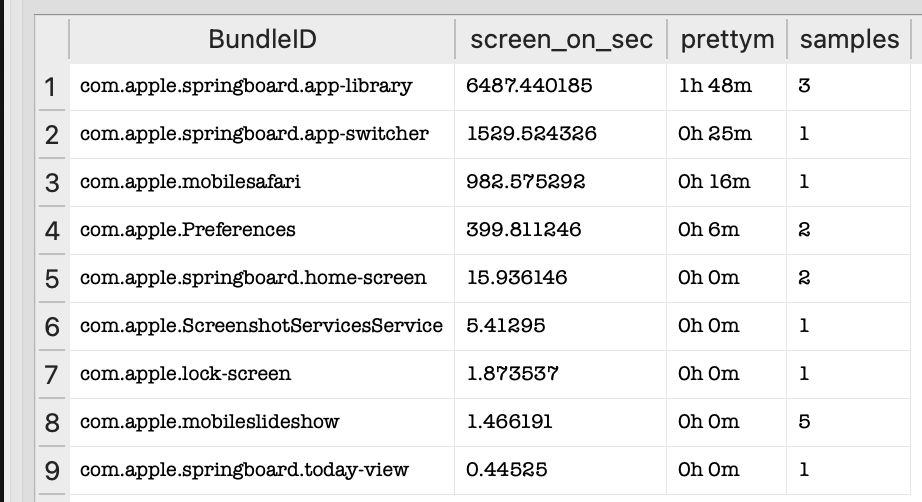
And it works! It finds 1h 48m of focused time on com.apple.springboard.app-library,
9
SpringBoard is the name of the application that handles the home screen.
which is the screen past your last home screen page.
This is all great in theory, but most people's devices aren't jailbroken. So how can you find where the grey bars are coming from on a normal device?
Bringing this to stock iOS
We can't get access to knowledgeC.db, or CoreDuet logs, or RMAdminStore-Local.sqlite from backups (though if you sync Screen Time across devices on iCloud you can access part of it in the shared cache on macOS). But what we can use is sysdiagnose.
A sysdiagnose collects a host of debug files into one archive so Apple or other engineers can debug an issue on your phone. Because it's supposed to be a catch-all regardless of the bug, it casts a pretty large net.
10
Much like those draped over Shackleton's Quest ship by bottom trawling. Whoops! Still fish though.  It's bad that trying to give a crash report to an app developer includes the name and SSID of every WiFi network you've ever connected to, and when. It's great for us! You can trigger one just by holding the Volume Up, Volume Down, and Lock buttons all at the same time for around a second (it will give a quick vibration).

After a few minutes (~45s for me) this file is accessible in scp if you're lazy with scp -r 'mobile@192.168.0.40:/private/var/mobile/Library/Logs/CrashReporter/DiagnosticLogs/sysdiagnose/sysdiagnose_*' ~/Desktop/
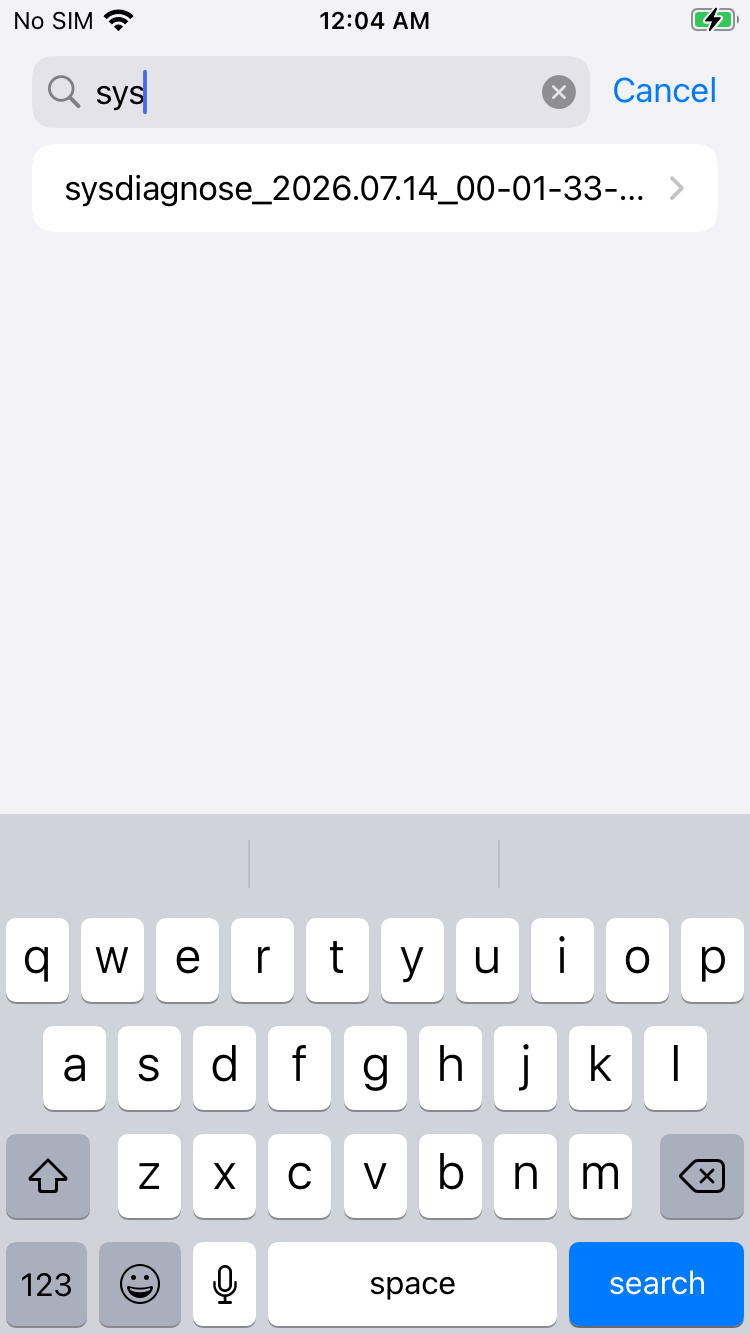
If you unzip the .tar.gz file and go to ./logs/powerlogs there should be a .PLSQL file that starts with powerlog_. Open that up! This truncates data and isn't 1:1 with knowledgeC.db or RMAdminStore-Local.sqlite, but it can point to smoking guns:
SELECT
  BundleID,
  SUM(ScreenOnTime) AS screen_on_sec,
  (CAST(SUM(ScreenOnTime) AS int)/3600)
    || 'h '
    || ((CAST(SUM(ScreenOnTime) AS int)%3600)/60)
    || 'm' AS prettym,
  COUNT(*) AS samples
FROM PLAppTimeService_Aggregate_AppRunTime
WHERE
  datetime(timestamp,'unixepoch','localtime') >= '2026-07-12 00:00:00'
  AND datetime(timestamp,'unixepoch','localtime') <  '2026-07-13 00:00:00'
GROUP BY BundleID
HAVING screen_on_sec > 0
ORDER BY screen_on_sec DESC;
The sources of grey bars
Running this on the jailbroken iPhone shows the same time for com.apple.springboard.app-library, but severely truncates the time for Preferences,
12
I think it truncates by Bundle ID (app), because this was higher for the same time period in a previous sysdiagnose.
while flagging some new processes: com.apple.springboard.app-switcher and com.apple.springboard.home-screen.
Running this on my non-jailbroken iPhone shows something similar, finally finding the missing 6 hours in com.apple.springboard.stand-by, with 6h 23m of time.
13
If you're doing the math, there's still 12 minutes missing. It's the apps that I truncated in both screenshots. Don't worry about it, okay? Yay ❤️.
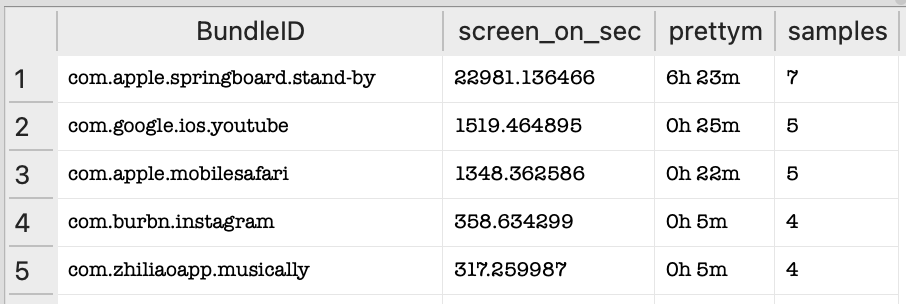
This is where the grey bars are coming from: SpringBoard. The App Library, the app switcher, the home screen, and StandBy are all Apple's core surfaces, included in usage but hidden from categories.
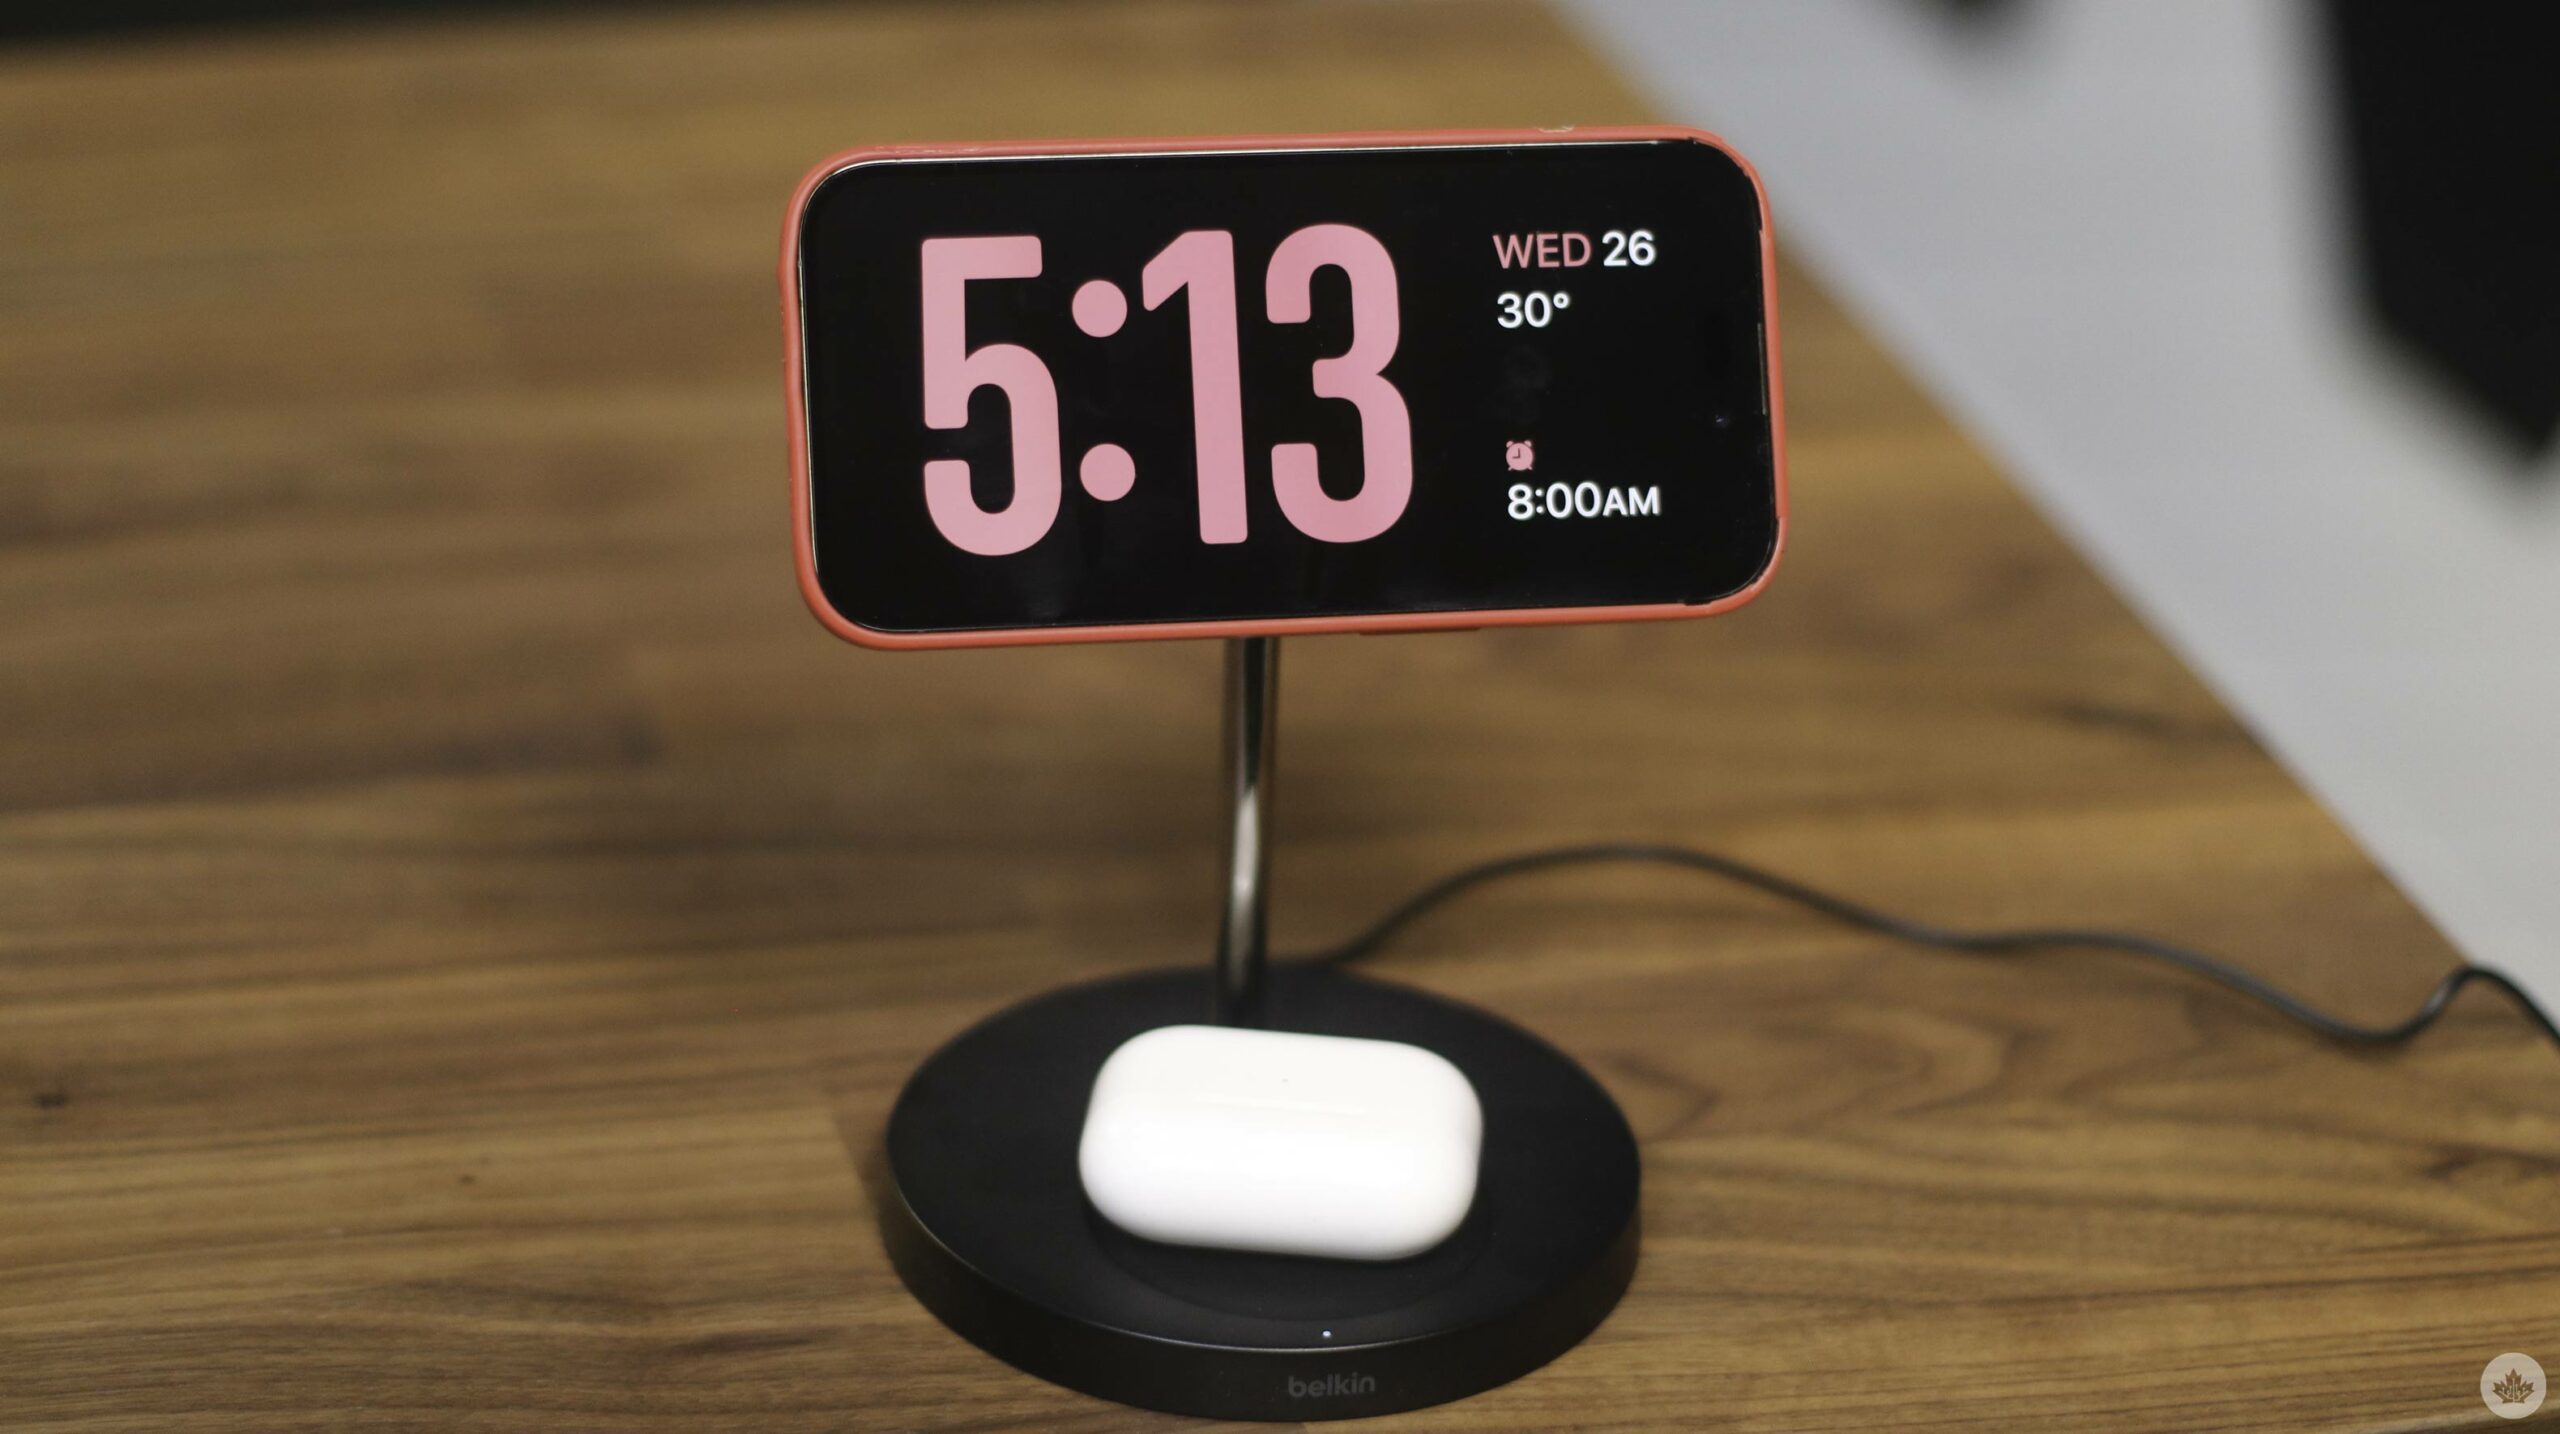
I think it's fair that the home screen counts against Screen Time, but StandBy being counted is something that has been repeatedly flagged by people with no updates (and apparently 365
Fixing it Finding workarounds
In the meantime, if you want StandBy, your best bet is using a third-party app that can do some post-processing. Opal used to solve this with a local VPN, and their current approach may still handle it. Another app, Timing, explicitly calls out filtering StandBy time in a July 2025 app update, so they should have it covered:
Fixed an issue where large amounts of times for a “com.apple.springboard.stand-by” app would be imported from Screen Time.
And with time, maybe Apple will fix StandBy being counted, and add categories for home screen time usage. Maybe. Eventually. Please?
-
Couldn't tell you why I use grey instead of gray. The 'a' just feels so harsh. ↩︎
-
If you're a destination over journey type, jump here. But why? Life's short, but the road is always better than the inn. ↩︎
-
You can install from GitHub and then triple-tap any screen to inspect views and controllers. ↩︎
-
Secure Copy, as opposed to the paranormal SCP. Probably? ↩︎
-
Admittedly he's less background and more upfront, though he's certainly in the know on events! ↩︎
-
I didn't breakpoint on writes to the DB, so not sure exactly how it's aggregated. ↩︎
-
66 of them on my device, ranging from
/notification/usageto/media/nowPlayingto/display/orientationand more! ↩︎ -
SpringBoard is the name of the application that handles the home screen. ↩︎
-
Much like those draped over Shackleton's Quest ship by bottom trawling. Whoops! Still fish though.
↩︎ -
Or
scpif you're lazy withscp -r 'mobile@192.168.0.40:/private/var/mobile/Library/Logs/CrashReporter/DiagnosticLogs/sysdiagnose/sysdiagnose_*' ~/Desktop/↩︎ -
I think it truncates by Bundle ID (app), because this was higher for the same time period in a previous
sysdiagnose. ↩︎ -
If you're doing the math, there's still 12 minutes missing. It's the apps that I truncated in both screenshots. Don't worry about it, okay? Yay ❤️. ↩︎
-
That's maybe for the best. ↩︎
v
i also spell grey with the e, and i had never heard of standby before this post. very informative 5/5 stars
Kalem Krebs
Very helpful! Merci monsieur